On the Road to Recovery
2004 Finishing Market Survey

Secretary of Defense Donald Rumsfeld made unwanted headlines when a private memo he had written stating that the wars in Iraq and Afghanistan will be "a long, hard slog" was leaked to the press. The finishing industry and manufacturing in general have endured their own slog, but there are signs indicating that the slog has more to do with what we see in the rearview mirror than along the road ahead.
The economic picture in late November was brighter than in the previous 10 months and far better than analysts had predicted. The Commerce Department reported that the economy grew at an annualized rate of 8.2% in the third quarter, the fastest pace in nearly two decades. The Labor Department reported that third-quarter worker productivity rose 9.1% from the previous quarter, the largest increase since the second quarter of 1983. And the Conference Board's Consumer Confidence Index, after rebounding in October, rose again in November to 91.7, its highest level since the fall of 2002 and well ahead of the 85.0 analysts had predicted.
Finishers, too, are more upbeat about business prospects in the coming year, according to Industrial Paint & Powder's 17th annual Finishing Market Survey. Of 618 respondents, 59% say that their operating levels in 2004 would be higher than in 2003. In last year's survey, only 53% of respondents said their operating levels would increase. Two years ago, only 43% of respondents indicated business would increase. On the other hand, only 4% of respondents said their operating levels would decrease in 2004. Last year, 5% of respondents said business would decline; two years ago, 13% said business would fall. About 37% of respondents indicate that business will remain about the same as last year.
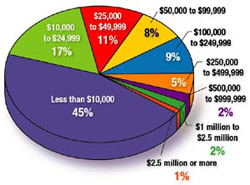
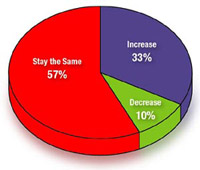
The number of finishers saying they would increase spending for finishing equipment-33%-is about the same as for last year (Figure 1), while the percentage saying they would decrease spending-10%-is also similar to last year's figure. About 57% of respondents indicated that their spending would remain the same. Of the nine spending categories, each of which indicates a range of the amount finishers plan to spend, nearly the same percentage of finishers fell into each category as last year (Figure 3).
On average, the surveyed companies estimated that they would spend nearly 32% of their 2004 finishing budgets on liquid application equipment. That's about the same as the last couple of years. Companies say they will spend about 23% of their budgets on powder spraying equipment, up about 8% over the last two years. Companies will spend about 39% of their budgets on support equipment, a little less than last year, but up from 34% two years ago (Figure 4).

Other reasons for purchasing new equipment include:
- Increase capacity, 39%
- Improve coatings appearance/performance, 39% (consistent with the last few years)
- Environmental compliance, 26% (this percentage has continued to decline in the last few years)
- Expand/improve color-change capabilities, 12% (about the same as the last several years)
- Conversion to new coating system, 12% (about the same as the last several years)

In the plant
Capacity-utilization rates in 2003 changed little from 2002 rates. The capacity-utilization-rate categories were:- Less than 50% capacity, checked by 25% of respondents
- 50 to 59% capacity, 13%
- 60 to 69% capacity, 14%
- 70 to 79% capacity, 17%
- 80 to 89% capacity, 15%
- 90% capacity or more, 16%
Other trends and forecasts
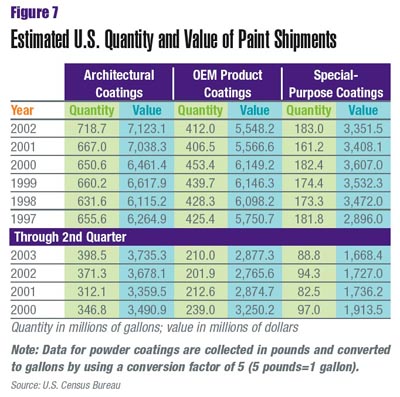
According to the latest Census Bureau data (Figure 7), OEM coatings shipments for the first half of 2003 are up about 4% over the first half of 2002, but slightly below first-half 2001 levels. Shipments of special-purpose coatings fell from 94.3 million gallons in the first half of 2002 to 88.8 million gallons in the first half of 2003.From 1996 through 2000, shipments of OEM coatings showed healthy gains each year, increasing from nearly 399 million gallons of paint in 1996 to 453 million gallons in 2000, before declining to 407 million gallons in 2001 and 412 million gallons in 2002. Shipments of special-purpose coatings fared more poorly, declining from nearly 209 million gallons in 1996 to 181 million gallons in 2000 and 149 million gallons in 2002.
About one in six of those who added a comment at the end of the survey expressed concern about China-about the jobs moving there or the unfair advantage China enjoys as a result of labor costs. There were only a couple of comments in last year's survey about the NAFTA agreement in general.
On a more positive note, the National Association of Manufacturers is upbeat about a number of trends that point to an improved manufacturing situation. Besides rising consumer optimism, "inflation and interest rates are in check, inventories are worked off and capital equipment is rising, says Jerry Jasinowski, NAM's president. "Now a long-awaited correction of the dollar relative to the euro offers the promise of a rebound of exports. Growing exports will fuel job recovery."
NAM is also upbeat about the promise of technology to aid manufacturing. "Technology will continue to improve productivity, shorten their time to market, manage the lifecycles of their products and improve profitability," says Stuart Doyle, senior vice president of EDS, an information technology company. "The future holds great promise for new and exciting applications of technology in manufacturing."
However, Jasinowski cautions that there are still structural problems in manufacturing that need to be addressed. "We still must find a way to deal with Chinese and other Asian currencies that are held by their governments at artificially low levels," he says.
The NAM president also cited the escalating costs of domestic production. "Faced with relentless foreign competition, manufacturers have no power to raise the prices of their products. But the costs of production are rising-health care, regulation, litigation, energy."
Editor's Note: Industrial Paint & Powder would like to thank the many readers who took time to participate in this year's market survey. To gather information for the survey, questionnaires were mailed in September to a representative sample of senior-level manufacturing managers at 3,500 U.S. finishing locations. A total of 737, or 21%, were returned. A sample this size offers a 3.5% margin of error at a 95% confidence level. This survey's intent is to highlight industry trends rather than set specific dollar expenditures for individual sectors of the market. We welcome comments and suggestions regarding the survey. Send them to greisselm@bnp.com.
SIDEBAR: The "Typical" Finisher
Finishing operations vary widely in size and scope of operations; thus, attempting to provide a snapshot of the "typical" finisher is no easy task. But the responses to Industrial Paint & Powder magazine's 17th annual Finishing Market Survey provide detailed information about staffing, spending, application methods and much more for small and large finishers alike.While finishing facilities that use a relatively small amount of liquid paint comprise a huge portion of all facilities using liquid coatings, the same is less true for powder finishers. Of those respondents using liquid coatings, 43% use less than 100 gallons per month; 100 to 249 gallons, 20%; 250 to 499 gallons, 7%; 500 to 999 gallons, 9%; 1,000 to 2,499 gallons, 10%; and 2,500 gallons or more, 11%. Conversely, about 14% of shops applying powder coatings use less than 100 pounds per month; 100 to 249 pounds, 12%; 250 to 499 pounds, 7%; 500 to 999 pounds, 12%; 1,000 to 2,499 pounds, 20%; and 2,500 pounds or more, 35%.
A majority of the respondents (62%) say their finishing operations occupy less than 10,000 square feet; about 37% occupy less than 5,000 square feet. About 7% occupy 50,000 square feet or more.
When asked about the age of their equipment, nearly 26% of respondents said their liquid application equipment was less than three years old; 32%, three to five years old; 24%, six to 10 years old; 18%, more than 10 years old. These numbers were very close to last year's numbers. Regarding powder application equipment, 24% of respondents said their equipment is less than three years old (compared to 33% two years ago); three to five years old, 33% (compared to 38% last year); six to 10 years old, 29%; and more than 10 years old, 14%.
On average, respondents say that about 16 people are directly involved in the company's finishing activities, though 68% of respondents say they employ 10 people or fewer. The number of people involved in finishing, according to respondents, has fallen significantly the last few years.
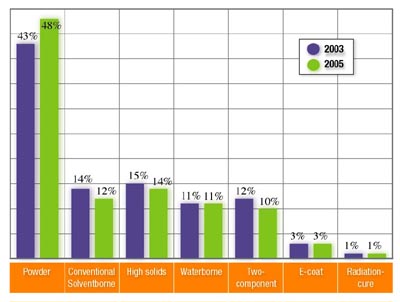
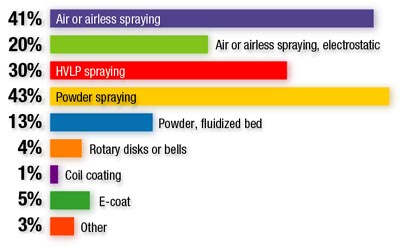
How are those employees applying paint and powder? About 41% of respondents use air or airless spraying, which is about the same as last year but down from 48% two years ago. That category is now slightly behind powder spraying (43%), up from 34% a few years ago. Nearly one-third employ HVLP spraying and 20% use electrostatic liquid spray equipment (Figure 2).
And what are they coating? Ferrous metals account for 66% of total coating volume, while nonferrous metals account for 19%. Those numbers have remained fairly consistent over the last several years, though ferrous metals are up and nonferrous down several percentage points compared to last year, and respondents say they are unlikely to change over the next two years. Plastic and wood both account for about 6% of total coatings volume.
About 18% of respondents say they are reformulating their coatings. Of those that do, a majority (51%) add solvents. They also add pigments (21%), and other additives (28%)
Looking for a reprint of this article?
From high-res PDFs to custom plaques, order your copy today!

